To open long positions on GBP/USD, you need:
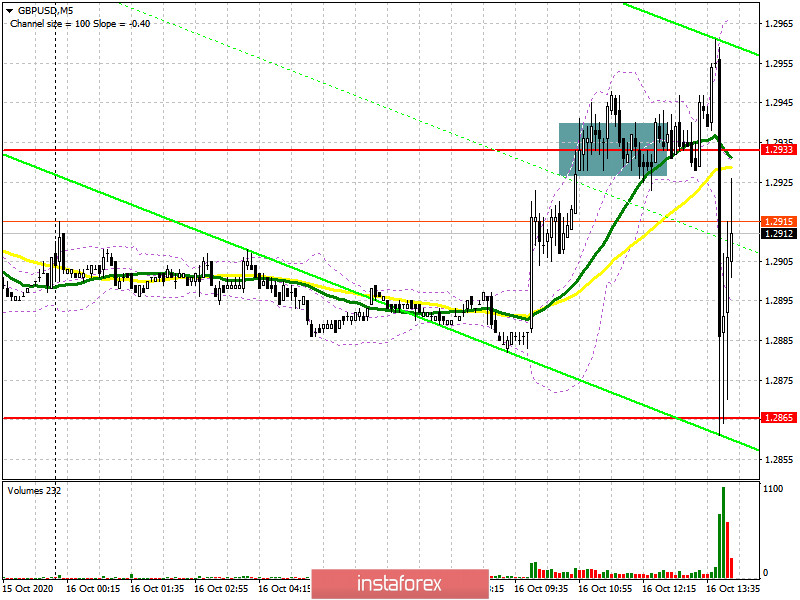
In the first half of the day, it was not possible to generate signals for entering the market. As seen on the 5-minute chart, the level of 1.2933 was blurred as a result. Because of this, it was not possible to get a clear signal to buy or sell the pound. After that, British Prime Minister Boris Johnson made several statements related to the EU and the trade agreement, which led to a sharp spike in market volatility. However, given the nature of the statements, this did not affect the technical picture of the pair.
In the second half of the day, buyers of the pound will now focus on the resistance of 1.2945, the consolidation of which will open the opportunity for a new wave of growth of GBP/USD in the area of 1.3008. However, only good news from the EU will support the British, which will lead to a test of the maximum of 1.3080, where I recommend fixing the profits. An equally important task will be to protect the support of 1.2865, which the bulls managed in the first half of the day. In the case of a repeated decline of the pair at the US session, the formation of a false breakout will be a signal to open new long positions in the expectation of strengthening GBP/USD. If there is no bull activity in this range, it is better not to hurry with purchases, but wait for the test of the nearest major support level in the area of 1.2807. You can also open long positions immediately on the rebound from the minimum of 1.2749 to correct 20-30 points within the day.
To open short positions on GBP/USD, you need:
In the afternoon, sellers need to defend the resistance of 1.2945, but much will depend on the news on the trade agreement and the decisions taken during today's European Union summit. Only the formation of a false breakout at the level of 1.2945 forms a signal to sell the pound, but for major bearish pressure, bad news on Brexit is needed, which is expected today in the afternoon. After fixing below the support of 1.2865, then we can expect a new and larger wave of decline in the pair with a return to the area of 1.2807. A longer-term goal will be a minimum of 1.2749, where I recommend fixing the profit. If the pair grows in the second half of the day and there is no activity in the resistance area of 1.2945, it is best to postpone short positions until the maximum test of 1.3008, where you can sell the pound immediately for a rebound in the expectation of correction of 20-30 points within the day.
Let me remind you that in the COT reports (Commitment of Traders) for October 6, there was a minimal increase in short non-commercial positions from the level of 51,961 to the level of 51,996. Non-commercial long positions have increased slightly from the level of 216,39 to level 40,698. As a result, the non-commercial net position remained negative and amounted to -11,298 against -12,745, which indicates that sellers of the British pound remain in control and have a minimal advantage in the current situation. The higher the pair grows, the more attractive it will be for sale.
Signals of indicators:
Moving averages
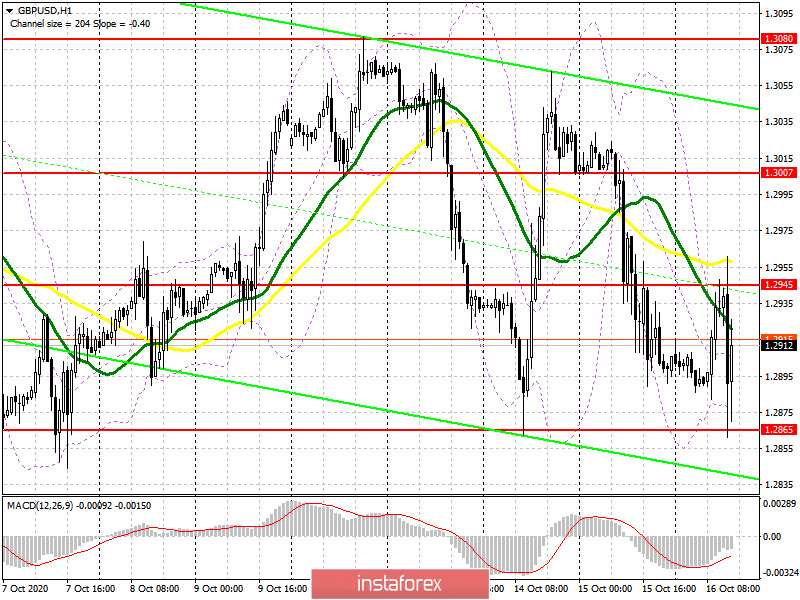
Trading is conducted in the area of 30 and 50 daily averages, which indicates an active confrontation between buyers and sellers.
Note: The period and prices of moving averages are considered by the author on the hourly chart H1 and differ from the general definition of the classic daily moving averages on the daily chart D1.
Bollinger Bands
If the pair grows, the upper limit of the indicator will act as a resistance in the area of 1.2945, a break of which will lead to a new strengthening of the pound.
Description of indicators
- Moving average (moving average determines the current trend by smoothing out volatility and noise). Period 50. The graph is marked in yellow.
- Moving average (moving average determines the current trend by smoothing out volatility and noise). Period 30. The graph is marked in green.
- MACD indicator (Moving Average Convergence / Divergence - moving average convergence / divergence) Fast EMA period 12. Slow EMA period 26. SMA period 9
- Bollinger Bands (Bollinger Bands). Period 20
- Non-profit speculative traders, such as individual traders, hedge funds, and large institutions that use the futures market for speculative purposes and meet certain requirements.
- Long non-commercial positions represent the total long open position of non-commercial traders.
- Short non-commercial positions represent the total short open position of non-commercial traders.
- Total non-commercial net position is the difference between the short and long positions of non-commercial traders.